Football Genius
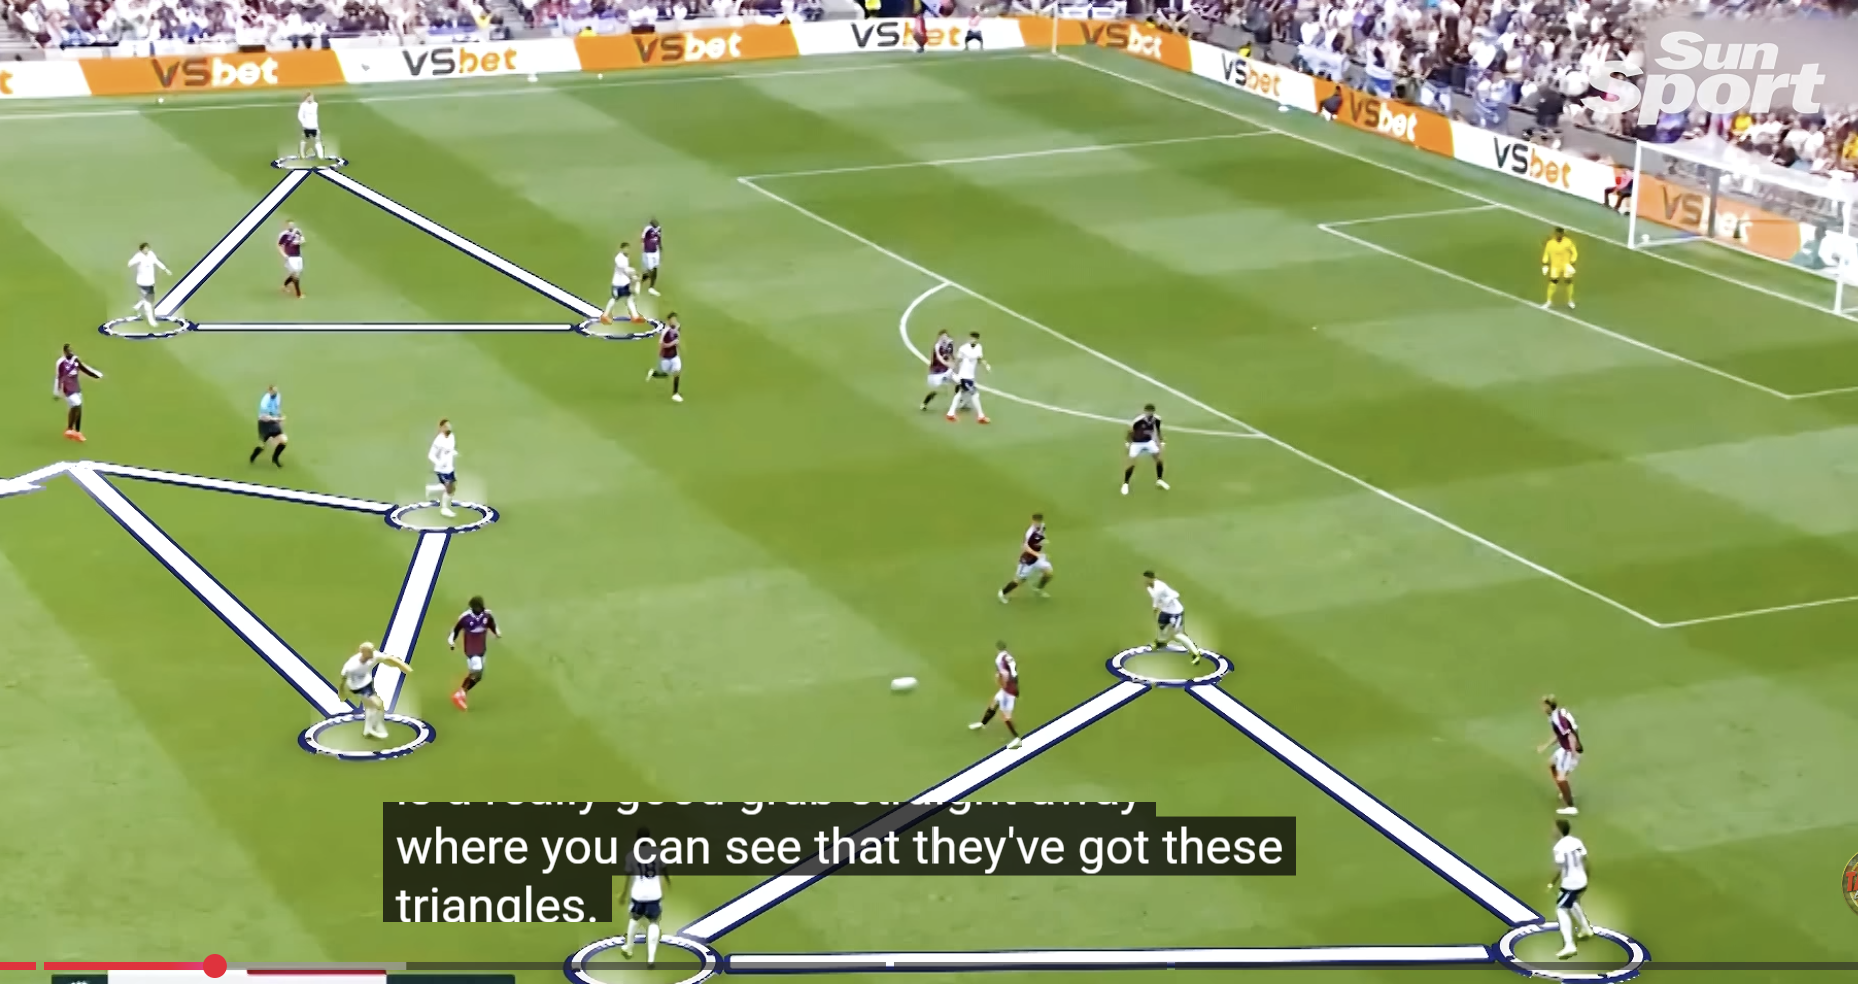
It’s a matter of fact that you can draw a triangle between any three players on the field.
In fact, with 11 players, you have 165 co-existing triangles at all times.
My innovation – track all 165 triangles against all other stats.
For every video frame (from up in the air with a drone looking down at the pitch), each of the 165 triangles will have measurable variables such as:
• area
• perimeter
• side lengths
• internal angles
• orientation relative to goal
• centroid location
• rate of expansion or contraction
• rotation rate
• deformation rate
• distance to ball
• whether the ball is inside the triangle
• whether an opponent is inside the triangle
• number of opponents intersecting its edges or passing lanes
• possession state
• player roles and identities
• pitch zone
• pressure on each vertex
• available passing lanes between vertices
You then stop asking whether a team “forms triangles” and start asking measurable questions such as whether particular triangle geometries precede line breaks, progressive passes, turnovers, shots, entries into the box or defensive failures.
The more interesting level is temporal. A triangle that rapidly expands, rotates or changes orientation may carry more information than its static shape. You could therefore model each triangle as a time series and test whether particular geometric transitions predict subsequent events.
You could also compare the 165 attacking-team triangles with the 165 opposition triangles, giving 27,225 pairwise triangle relationships per frame. That creates a very large feature space, but much of it can be reduced using spatial proximity, overlap, shared zones or relevance to the ball.
The core statistical question would be whether triangle-derived variables add predictive information beyond existing player-tracking features such as spacing, pitch control, passing networks and expected possession value. If they do, then the triangle is not just a visualisation device. It becomes a genuine unit of tactical measurement.
LOL.