Fibonacci Retracement
A Fibonacci retracement is a popular tool amongst traders of stock, currencies and derivatives, and also with superannuation managers that have a need to baffle their clients with bullshit.
The Fibonacci sequence of numbers is 0, 1, 1, 2, 3, 5, 8, 13, 21, 34, 55, 89, 144, etc.
Each number is approximately 1.618 times greater than the preceding number. Which is how we get the so-called average Fibonacci ratio of 61.8%.
The 38.2% ratio is found by dividing one number in the series by the number that is found two places to the right.
The 23.6% ratio is found by dividing one number in the series by the number that is three places to the right.
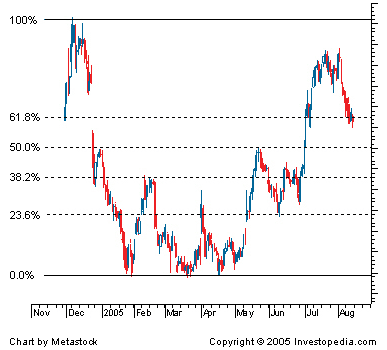
A Fibonacci retracement line is created by taking two extreme points (usually a major peak and trough) on a stock chart and dividing the vertical distance by the key Fibonacci ratios of 23.6%, 38.2%, 61.8%. And for good measure they usually add 50% and 100% – these representing nice and wholesome round numbers that are easy to admire.
At each of these percentages the chartists draw horizontal lines that are used to predict support and resistance levels, i.e. the critical points that might correlate to a point on the chart where an asset’s price will reverse, or not.
Traders believe that the direction of the prior trend before a curve hits a Fibonacci retracement (or the 50% and 100% lines) is likely to continue once the price of the asset has retraced to one of the ratios.
So what’s really going on? Well:
1. Because so many people believe this stuff there’s enough of them behaving a certain way with their trading that they might make these retracement lines a self-fulfilling prophecy.
2. There’s enough horizontal lines drawn all over a chart such that any reversal is near enough to one of the lines so the argument that the lines are meaningful can just about always be upheld, at 100 paces at sunset with one’s eyes squinting.
3. The chartists and tech-traders have a form of Stockholm Syndrome where they believe that there is something mystical or mathematically baffling behind the movement of stocks, currencies and derivatives. And they love the sexy sounding Fibonacci moniker which they barely understand.
4. And the traders really do need to feel special about what is essentially guesswork. Trading at a profit over time really only occurs when there is some sort of information asymmetry with respect to the asset in question.
I would also point out that the Golden Ratio of 61.8% was discovered millennia before Fibonacci was born. The ancient Greeks developed the Golden Ratio – where two quantities are in the golden ratio if their ratio is the same as the ratio of their sum to the larger of the two quantities.
Calling a line which just happens to be at the 61.8% point between two other lines the Fibonacci retracement is clearly an exercise in putting lipstick on a very dour pig.
Imagine if they just got sensible and used 20%, 40%, 60%, 80% and 100%? Nuh, there’s no magic there to bullshit about.
The best bit is that there is probably no correlation between the lines and when a stock reverses and certainly no causation.
Well, to be fair, there might be a correlation if you allow for error bars as large as the gap between adjacent lines.