The cost of cars
Three interesting graphs from the US.
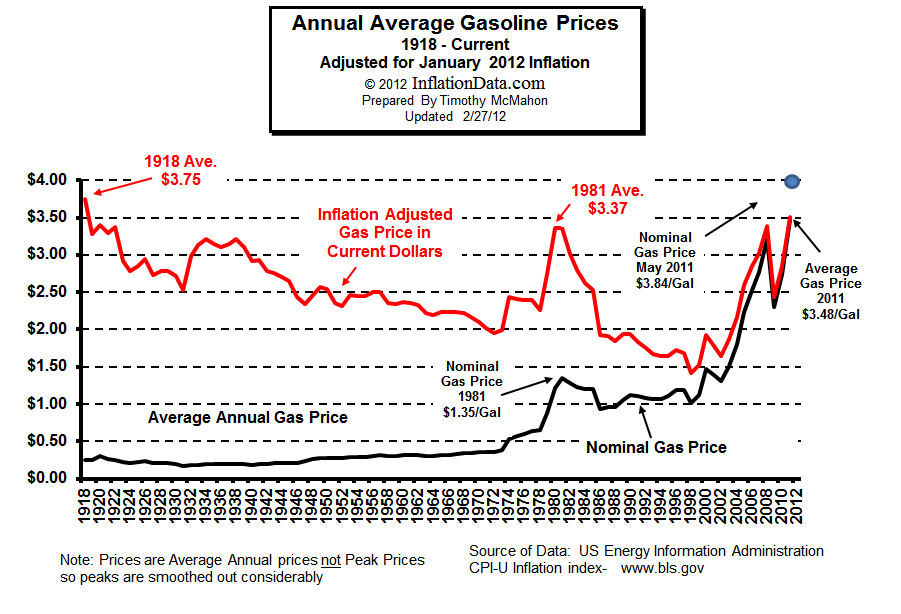
In inflation adjusted dollar terms, petrol prices have remained between $1.50-4 per gallon for the last century. Until 2000 the long term price trend was downwards probably representing enhanced productivity for exploration, extraction and transport. Since 2000 the price has been trending upwards reflecting the diminution of supplies compared to demand.
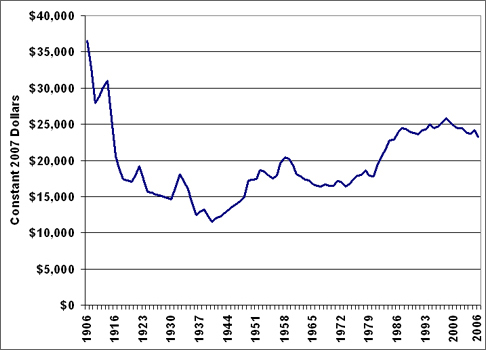
In inflation adjusted terms, new car prices started high at $35k in 1906 but pretty quickly dropped, and since 1916 they have been trading in a range between $10k and $25k. The slow increase in new car prices over this period represents the fact that people have been getting a lot more for their money as technology has improved over the years. This slow increase in average price has been enabled by increasing purchasing power.
I would note that Tata (with their Nano) has shown that if we built a T-model Ford today, in volume, we could probably sell it for $2k at a profit.
In real terms neither the price of cars nor petrol has significantly changed for over a century. What has changed is median income which, in inflation adjusted dollars, has gone from $10-15k at the start of the 1900’s, steadily increasing in a linear fashion to around $70k in 2004 (in the West).
So in terms of affordability the costs of purchasing and running a car have shrunk by a factor of about 7 over the last century. No wonder there is so many of them out there.